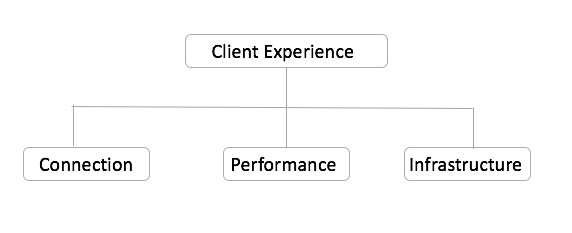
Ensuring a superior client experience is a top priority for network administrators. To achieve this, network administrators continuously assess network health in three primary areas: connection, performance and infrastructure.
Top Questions for Network Service Assurance
If we jot down the top three questions in a network admin’s mind for each of these categories, they would likely be:
- Connection
- Are my clients able to connect in a timely manner?
- Do they stay connected?
- Is their roaming experience stable?
- Performance
- Is my coverage reliable?
- Is the quality of the connection optimal?
- Are the access points (APs) serving at full capacity?
- Infrastructure
- Are the APs online and service available?
- Do they have sufficient resources?
- Is the link between the acces points and the controller healthy?
If the answer to any of the above questions is no, there are almost certainly network issues that must be resolved. Automatically detecting and determining the root cause of network issues is not a straightforward process. It generally involves analyzing a combination of network events, configuration changes and key performance indicators (KPIs) to understand the full picture.
CLICK TO TWEET CommScope’s Lakshmi Nagarajan explains how incident detection, prioritization and scope are three key areas to network analytics.
Detecting network service incidents is not easy
“Is my network coverage reliable and optimal?” is a loaded question. Even if we assume the network is well deployed, there are still many layers to explore before this query can be answered, including:
Do the KPIs such as RSS, MCS, and client throughput look good for the clients in various areas of the network? If not, it opens up the next set of questions that need to be answered:
- Do we see anything in access point events (like reboots or ping loss) that indicate certain areas of the network have coverage dead zones?
- Is the channel distribution good? Is the interference low?
- Do the accesss points in the affected areas have configs like background scan or SmartRoam turned on?
- Based on the answers to the above questions, administrators will need to drill down to the next level of detail, and so on.
The Q&A sequence outlined above illustrates that the detection of network issues and determining the root cause of failures in a timely manner is not an easy task.
How CommScope’s RUCKUS Analytics goes beyond incident detection
CommScope’s RUCKUS Analytics processes vast amounts of data from RUCKUS access points and ICX switches to automatically detect a wide range of network issues. RUCKUS Analytics continuously monitors and analyze the patterns of KPIs, the occurrence of events, and the changes in config states to build a robust, scalable, and meaningful incident detection mechanism to assist customers with network troubleshooting. Incidents are classified into three main categories: connection, performance, and infrastructure. This aligns with the three primary categories network administrators use to assess network health.
While most products in the market today focus solely on incident detection and some root cause analysis, RUCKUS Analytics offers two additional important incident definition options: prioritization and scope.
In my next blog, I’ll talk about prioritization of service incidents and unsupervised machine learning for incident analytics. Until then, check out this short screen capture demo video.


